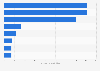
| Characteristic | 2017 | 2018 |
|---|---|---|
| - | - | - |
| - | - | - |
| - | - | - |
| - | - | - |
| - | - | - |
| - | - | - |
| - | - | - |
The chart is not accessible to screen readers. Please switch to the table view to access the data.
Download
Source
Source
Release date
June 2018
More information
Region
Italy
Survey time period
January to May 2017 and 2018
Number of respondents
191**
Special properties
Energy managers
Method of interview
Questionnaire
Supplementary notes
*The sample analyzed was distributed among the industry sectors as follows: 12 percent food; seven percent automotive; one percent cement; six percent paper and printing; 28 percent chemical and petrochemical; four percent wood and furniture; ten percent electronics and devices; three percent pharmaceutical; nine percent metallurgic; one percent plastic and rubber; six percent textile; 13 percent glass and pottery.
**In 2017 the count was 183.
Citation formats