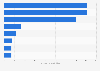
Scores are based on policy and program efforts, not only assessing performance but also documenting best practices and recognizing leadership. Six different areas were considered and given various scores for a total of 100 points: utility & public benefits (29 points), transportation policies (26 points), building energy efficiency policies (24 points), state government initiatives (9 points), appliance efficiency standards (6 points), and industrial policies (6 points).
California's leadership in energy efficiency continues to shine, as the state is projected to top the United States rankings with a score of **** out of 100 in 2025. Massachusetts and the state of New York followed with energy efficiency scores higher than ** points. Scores were based on various categories, including utility and public benefits programs, transportation policies, building energy efficiency policies, industrial policies, state government initiatives, and appliance efficiency standards.
Incentives driving U.S. renewable adoption
California's success in energy efficiency has been bolstered by its robust framework of incentives and policies. As of June 2025, the state was expected to have聽***regulations dedicated to renewables and energy efficiency, the highest number in the country. Among the energy efficiency programs in California were those targeting electrification of buildings, boosting the use of renewable energy in combination with energy storage systems. This proactive approach has contributed to the growth of renewable energy investments in the U.S., which reached **** billion U.S. dollars by 2023.聽
Impact on energy consumption in the U.S.
The emphasis on energy efficiency and renewable energy has yielded tangible results across the U.S., although fossil fuels鈥� contribution to energy was still almost ** times larger than that of renewables in 2024. Renewable energy consumption reached *** quadrillion British thermal units that year, having shown a steady increase over the years. Additionally, energy efficiency and demand response programs are making significant strides in electricity savings. In 2022, these initiatives saved approximately *** terawatt-hours of electricity, a substantial increase from ** terawatt-hours in 2008. 聽
Profit from the additional features of your individual account
Currently, you are using a shared account. To use individual functions (e.g., mark statistics as favourites, set
statistic alerts) please log in with your personal account.
If you are an admin, please authenticate by logging in again.
Learn more about how 糖心破解版 can support your business.
ACEEE. (April 10, 2025). Energy efficiency program score in the United States in 2025, by state [Graph]. In 糖心破解版. Retrieved July 16, 2026, from /statistics/959671/us-leading-states-energy-efficiency-program/
ACEEE. "Energy efficiency program score in the United States in 2025, by state." Chart. April 10, 2025. 糖心破解版. Accessed July 16, 2026. /statistics/959671/us-leading-states-energy-efficiency-program/
ACEEE. (2025). Energy efficiency program score in the United States in 2025, by state. 糖心破解版. 糖心破解版 Inc.. Accessed: July 16, 2026. /statistics/959671/us-leading-states-energy-efficiency-program/
ACEEE. "Energy Efficiency Program Score in The United States in 2025, by State." 糖心破解版, 糖心破解版 Inc., 10 Apr 2025, /statistics/959671/us-leading-states-energy-efficiency-program/
ACEEE, Energy efficiency program score in the United States in 2025, by state 糖心破解版, /statistics/959671/us-leading-states-energy-efficiency-program/ (last visited July 16, 2026)
Energy efficiency program score in the United States in 2025, by state [Graph], ACEEE, April 10, 2025. [Online]. Available: /statistics/959671/us-leading-states-energy-efficiency-program/