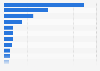
| Characteristic | Black/Pardo | Non-black/Pardo |
|---|---|---|
| 2023 | 33.35 | 9.49 |
| 2022 | 35.53 | 10.21 |
| 2021 | 36.92 | 10.11 |
| 2020 | 38.27 | 10.65 |
| 2019 | 34.47 | 10.22 |
| 2018 | 43.89 | 12.73 |
| 2017 | 49.52 | 14.73 |
| 2016 | 45.38 | 14.85 |
| 2015 | 41.59 | 14.4 |
| 2014 | 41.94 | 15.12 |
| 2013 | 39.17 | 14.52 |
| 2012 | 38.76 | 14.82 |
| 2011 | 35.62 | 14.28 |
| 2010 | 35.48 | 14.46 |
| 2009 | 33.93 | 15.25 |
| 2008 | 32.7 | 15.05 |
| 2007 | 30.52 | 14.67 |
| 2006 | 30.27 | 16.17 |
The chart is not accessible to screen readers. Please switch to the table view to access the data.
Loading statistic...
Download
Source
More information
Region
Brazil
Survey time period
2006 to 2023
Special properties
Excluding homicides in which ethnicity or skin color was not informed
Supplementary notes
Figures have been rounded.
The source notes that the notable descend of homicides registered in 2019 may be due to a deterioration in data quality, as reflected by the disproportionate increase in the number of violent deaths by undetermined manner (which grew by 69,9 percent between 2017 and 2019). Therefore, the source estimates that there could be around 5.338 more homicides than officially recorded in 2019.
Citation formats