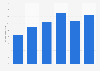
| Characteristic | 2013 | 2019 |
|---|---|---|
| - | - | - |
| - | - | - |
| - | - | - |
| - | - | - |
| - | - | - |
| - | - | - |
| - | - | - |
| - | - | - |
| - | - | - |
| - | - | - |
| - | - | - |
The chart is not accessible to screen readers. Please switch to the table view to access the data.
July 2020
Europe
2013 and 2019
2,839*
Hotel associations from HOTREC member countries
Online survey
*Data for the whole study was based on observations from 2,839 European hotels (2,156 respondents from individual hotels collected through an online survey with 24 countries. Five countries (Italy, Germany, Switzerland, Greece, Sweden) had more than 100 responses each, providing around 80 percent of the total sample responses. In four countries (Germany, Croatia, Finland, Hungary) aggregated information from eight hotel chains provided data covering 683 properties.
Direct bookings include bookings made via phone, mail, fax, walk-in, email, and real-time bookings with the hotels own website.
Sample varies each year.