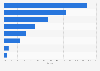
| Characteristic | Percentage of units sold |
|---|---|
| - | - |
| - | - |
| - | - |
| - | - |
| - | - |
| - | - |
| - | - |
| - | - |
| - | - |
| - | - |
| - | - |
| - | - |
| - | - |
| - | - |
| - | - |
| - | - |
| - | - |
| - | - |
| - | - |
| - | - |
| - | - |
| - | - |
| - | - |
| - | - |
| - | - |
| - | - |
| - | - |
| - | - |
| - | - |
| - | - |
The chart is not accessible to screen readers. Please switch to the table view to access the data.
Download
Source
Sources
Release date
August 2019
More information
Region
Worldwide, OECD
Survey time period
2018
Supplementary notes
Results reflect prescription drug sales in the national retail market based on manufacturer ex-factory list prices reported in the local currency of each country; average OECD sales were determined by converting all currencies into US dollars.
Citation formats