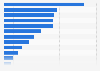
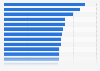
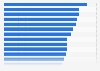
| Characteristic | 2010 | 2014 |
|---|---|---|
| - | - | - |
| - | - | - |
| - | - | - |
| - | - | - |
| - | - | - |
| - | - | - |
| - | - | - |
| - | - | - |
| - | - | - |
| - | - | - |
| - | - | - |
The chart is not accessible to screen readers. Please switch to the table view to access the data.
Download
Source
Source
Release date
January 2018
More information
Region
United States
Survey time period
2014
Number of respondents
28 U.S. states
Supplementary notes
Some stays included ADEs that originated during the stay and ADEs that were present on admission. These stays are counted once for each origin type; thus, the sum of the rates across origins may be higher than the overall rate for ADEs (as shown in Table 2).
Citation formats