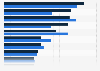


| Characteristic | Number of incidents |
|---|---|
| - | - |
| - | - |
| - | - |
| - | - |
| - | - |
| - | - |
| - | - |
| - | - |
| - | - |
| - | - |
| - | - |
| - | - |
| - | - |
| - | - |
| - | - |
| - | - |
| - | - |
The chart is not accessible to screen readers. Please switch to the table view to access the data.
Download
Source
Source
Release date
November 2023
More information
Region
Finland
Survey time period
Q3 2019 to Q3 2023
Special properties
Detected malware and malicious traffic
Supplementary notes
The source adds the following information: "These statistics demonstrate the number and duration of malware infections in computers connected to Finnish information networks. The source of the data is the Autoreporter service of the NCSC-FI at Traficom, which collects data on malicious network traffic detected on the internet. The data is published four times a year. When reading the graphs, it is good to remember that one infected computer may cause several Autoreporter observations on consecutive days if the malware has not been removed from the computer."
Citation formats



