


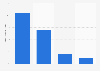

| Characteristic | Number of malware incidents |
|---|---|
| Public Administration (NAICS 92) | 993 |
| Information (NAICS 51) | 575 |
| Finance and Insurance (NAICS 52) | 522 |
| Professional, Scientific, and Technical Services (NAICS 54) | 502 |
| Healthcare and Social Assistance (NAICS 62) | 473 |
| Educational Services (NAICS 61) | 367 |
| Retail Trade (NAICS 44-45) | 277 |
| Manufacturing (NAICS 31-33) | 248 |
| Management of Companies and Enterprises (NAICS 55) | 117 |
| Transportation and Warehousing (NAICS 48-49) | 108 |
| Arts, Entertainment, and Recreation (NAICS 71) | 104 |
| Other Services (except Public Administration) (NAICS 81) | 97 |
| Real Estate Rental and Leasing (NAICS 53) | 94 |
| Accommodation and Food Services (NAICS 72) | 65 |
| Wholesale Trade (NAICS 42) | 57 |
| Utilities (NAICS 22) | 14 |
The chart is not accessible to screen readers. Please switch to the table view to access the data.
Loading statistic...
Download
Source
Source
Release date
May 2025
More information
Region
Worldwide
Survey time period
November 1, 2022 to October 31, 2023
Special properties
excluding incidents and breaches affecting individuals that cannot be tied to an organizational attribute loss
Supplementary notes
The source adds the following information: "All incidents included in this report were reviewed and converted (if necessary) into the VERIS framework to create a common, anonymous aggregate data set.
We also exclude incidents and breaches affecting individuals that cannot be tied to an organizational attribute loss."
Citation formats



