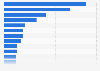
| Wealth group | Highest 20% | Fourth 20% | Third 20% | Second 20% | Lowest 20% |
|---|---|---|---|---|---|
| - | - | - | - | - | - |
| - | - | - | - | - | - |
| - | - | - | - | - | - |
| - | - | - | - | - | - |
| - | - | - | - | - | - |
| - | - | - | - | - | - |
| - | - | - | - | - | - |
| - | - | - | - | - | - |
| - | - | - | - | - | - |
The chart is not accessible to screen readers. Please switch to the table view to access the data.
Download
Source
Source
Release date
March 2023
More information
Region
Worldwide
Survey time period
2021
Supplementary notes
The G20 is an international organization whose permanent members are 19 countries and the European Union. Data for the European Union has been excluded due to overlap with G20 members France, Germany, Italy and the United Kingdom.
Data for income distribution is pooled by the World Bank from national data. Therefore, not all percentage breakdowns are sourced from the same survey period.
Figures may not sum to 100 percent due to rounding.
*Numbers are from 2020.
Citation formats