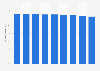
| Characteristic | Share of aging population |
|---|---|
| Kerala | 12.6% |
| Goa | 11.2% |
| Tamil Nadu | 10.4% |
| Punjab | 10.3% |
| Himachal Pradesh | 10.2% |
| Maharashtra | 9.9% |
| Andaman & Nicobar Islands | 9.8% |
| Puducherry | 9.7% |
| Odisha | 9.5% |
| Uttarakhand | 8.9% |
| Haryana | 8.7% |
| West Bengal | 8.5% |
| Lakshadweep | 8.2% |
| Tripura | 7.9% |
| Gujarat | 7.9% |
| Madhya Pradesh | 7.9% |
| Chhattisgarh | 7.8% |
| Karnataka | 7.7% |
| Uttar Pradesh | 7.7% |
| Rajasthan | 7.5% |
| Jammu & Kashmir | 7.4% |
| Bihar | 7.4% |
| Jharkhand | 7.1% |
| Manipur ** | 7% |
The chart is not accessible to screen readers. Please switch to the table view to access the data.
Loading statistic...
Download
Source
Sources
Release date
February 2016
More information
Region
India
Survey time period
2011
Supplementary notes
* Values expressed as a percentage of people aged 60 or above from the total population of the respective state.
** The figures include the estimated population of Mao Maram, Paomata and Purul sub-divisions of Senapati district of Manipur.
Citation formats