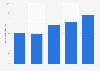
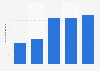
| Characteristic | Number of injuries |
|---|---|
| - | - |
| - | - |
| - | - |
| - | - |
| - | - |
| - | - |
| - | - |
| - | - |
| - | - |
| - | - |
| - | - |
| - | - |
| - | - |
| - | - |
| - | - |
| - | - |
| - | - |
| - | - |
| - | - |
| - | - |
The chart is not accessible to screen readers. Please switch to the table view to access the data.
Download
Source
More information
Region
United States
Survey time period
January 1 to December 31, 2019
Supplementary notes
Data are estimates of hospital emergency department-treated injuries associated with, but not necessarily caused by, the use of consumer products.
The source does not provide a publication date. Publication date is the date of access.
Figures have been rounded.
Citation formats