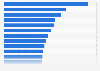
| Characteristic | Share of respondents* |
|---|---|
| - | - |
| - | - |
| - | - |
| - | - |
| - | - |
| - | - |
| - | - |
| - | - |
| - | - |
| - | - |
| - | - |
| - | - |
| - | - |
| - | - |
| - | - |
| - | - |
| - | - |
| - | - |
| - | - |
| - | - |
| - | - |
| - | - |
The chart is not accessible to screen readers. Please switch to the table view to access the data.
Download
Source
Source
Release date
September 2016
More information
Region
Worldwide
Survey time period
June 24 to July 8, 2016
Number of respondents
16,040 respondents
Age group
16 to 64 years
Method of interview
Online panel
Supplementary notes
This question was phrased by the source as follows: "Immigration is causing my country to change in ways that I don鈥檛 like"
* Share of respondents who answered 'strongly agree' or 'tend to agree' in response to the above statement.
Citation formats