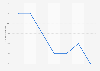
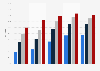
| Characteristic | Present level | Increased | Decreased |
|---|---|---|---|
| 2025 | 38% | 26% | 30% |
| 2024 | 25% | 16% | 55% |
| 2023 | 31% | 26% | 41% |
| 2022 | 31% | 27% | 38% |
| 2021 | 35% | 33% | 31% |
| 2020 | 36% | 34% | 28% |
| 2019 | 37% | 27% | 35% |
| 2018 | 39% | 28% | 29% |
| 2017 | 38% | 24% | 35% |
| 2016 | 38% | 21% | 38% |
| 2015 | 40% | 25% | 34% |
| 2014 | 33% | 22% | 41% |
| 2013 | 40% | 23% | 35% |
| 2012 | 42% | 21% | 35% |
| 2011 | 35% | 18% | 43% |
| 2010 | 34% | 17% | 45% |
| 2009 | 32% | 14% | 50% |
| 2008 | 39% | 18% | 39% |
| 2007 | 35% | 16% | 45% |
| 2006 | 42% | 17% | 39% |
| 2005 | 31% | 15% | 51% |
The chart is not accessible to screen readers. Please switch to the table view to access the data.
Loading statistic...
Download
Source
Source
Release date
July 2025
More information
Region
United States
Survey time period
December 2005 to June 2025
Number of respondents
1,402 respondents
Age group
18 years and older
Method of interview
Telephone interview
Supplementary notes
Respondents were asked: "Thinking now about immigrants (that is, people who come from other countries to live here in the United States), in your view, should immigration be kept at its present level, increased or decreased?"
Citation formats