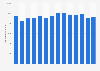
| Characteristic | Production in kilograms |
|---|---|
| 2017 | 2,710,000 |
| 2016** | 2,800,000 |
| 2015** | 2,660,000 |
| 2014** | 2,470,000 |
| 2013** | 2,280,000 |
| 2012 | 2,260,000 |
| 2011 | 2,180,000 |
| 2010 | 2,150,000 |
| 2009 | 2,160,000 |
The chart is not accessible to screen readers. Please switch to the table view to access the data.
Loading statistic...
Download
Source
Source
Release date
May 2020
More information
Region
Worldwide
Survey time period
2009 to 2017
Supplementary notes
* Kilograms of contained selenium
** Revised
Totals and estimated data have been rounded to no more than three significant digits. Insofar as possible, data relate to refinery output only; thus, countries that produced selenium contained in copper ores, copper concentrates, blister copper, and (or) refinery residues but did not recover refined selenium from these materials indigenously were excluded to avoid double counting. Includes data available through June 14, 2019.
Citation formats