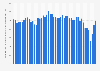
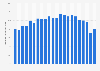
| Characteristic | Percentage of population in low income |
|---|---|
| 2022 | 6.6% |
| 2021 | 5.2% |
| 2020 | 4.8% |
| 2019 | 8.9% |
| 2018 | 9.8% |
| 2017 | 10.9% |
| 2016 | 11% |
| 2015 | 13.5% |
| 2014 | 13.5% |
| 2013 | 13.9% |
| 2012 | 15% |
| 2011 | 14.1% |
| 2010 | 14.3% |
| 2009 | 14.2% |
| 2008 | 15.4% |
| 2007 | 14.6% |
| 2006 | 13.8% |
| 2005 | 14.1% |
| 2004 | 13% |
| 2003 | 14.3% |
| 2002 | 13.7% |
| 2001 | 14.4% |
| 2000 | 15% |
The chart is not accessible to screen readers. Please switch to the table view to access the data.
Loading statistic...
Download
Source
Source
Release date
April 2024
More information
Region
Canada
Survey time period
2000 to 2022
Supplementary notes
The percentages are of adults who fall below the threshold of low-income measures (LIMs), 50% of adjusted median household income. Adjustments reflect the difference in needs of households based on the number of members. Adapted from Statistics Canada, statcan.gc.ca, 2000 to 2022. This does not constitute an endorsement by Statistics Canada of this product.
Citation formats