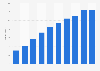




| Characteristic | Less than 50 euros | 50 to 100 euros | 100 to 500 euros | 500 to 1000 euros | 1000 euros or more | Don't know |
|---|---|---|---|---|---|---|
| - | - | - | - | - | - | - |
| - | - | - | - | - | - | - |
| - | - | - | - | - | - | - |
| - | - | - | - | - | - | - |
| - | - | - | - | - | - | - |
| - | - | - | - | - | - | - |
| - | - | - | - | - | - | - |
The chart is not accessible to screen readers. Please switch to the table view to access the data.
Download
Source
Source
Release date
October 2019
More information
Region
Netherlands
Survey time period
2012 to 2019
Number of respondents
4,500 respondents
Age group
12 to 74 years old
Special properties
Figures for 2014 are not provided by the source; Not including people in institutions, facilities and shelters
Method of interview
Computer-assisted telephone interviews (CATI)
Supplementary notes
The question was phrased by the source as follows: "In the past 3 months, how much do you estimate was the total amount you spent on ordering or purchasing online goods or services via internet?"
Citation formats



