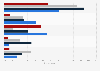
| Characteristic | 2014 | 2015 | 2016 |
|---|---|---|---|
| - | - | - | - |
| - | - | - | - |
| - | - | - | - |
| - | - | - | - |
| - | - | - | - |
| - | - | - | - |
| - | - | - | - |
| - | - | - | - |
| - | - | - | - |
The chart is not accessible to screen readers. Please switch to the table view to access the data.
Download
Source
Source
Release date
April 2016
More information
Region
Denmark
Survey time period
2014 to 2016
Number of respondents
29,780 consumers*
Age group
16-65 years
Special properties
internet users; Buzzador's members
Method of interview
Online survey
Supplementary notes
* The number of respondents only applies to all four countries Sweden, Denmark, Finland and Norway, as well as to the year 2016. The source does not specify the number of respondents in 2014 and 2015.
** wasn't asked 2014.
This question was phrased by the source as follows: "How often do you use the following for non-work-related purposes?"
The statistic only shows the answer "at least once a week".
Multiple answers were possible.
Citation formats