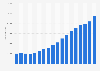
| Characteristic | Number of permit holders |
|---|---|
| 2023 | 1,081,780 |
| 2022 | 648,290 |
| 2021 | 430,200 |
| 2020 | 457,855 |
| 2019 | 453,250 |
| 2018 | 380,950 |
| 2017 | 336,000 |
| 2016 | 302,280 |
| 2015 | 261,600 |
| 2014 | 269,090 |
| 2013 | 253,880 |
| 2012 | 225,925 |
| 2011 | 197,240 |
| 2010 | 158,830 |
| 2009 | 139,810 |
| 2008 | 115,690 |
| 2007 | 92,880 |
| 2006 | 83,570 |
| 2005 | 73,760 |
| 2004 | 64,465 |
| 2003 | 54,320 |
| 2002 | 50,390 |
| 2001 | 46,880 |
| 2000 | 44,140 |
The chart is not accessible to screen readers. Please switch to the table view to access the data.
Loading statistic...
Download
Source
Source
Release date
December 2023
More information
Region
Canada
Survey time period
2000 to 2023
Supplementary notes
The International Mobility Programs include all work permit applications in Canada that do not require a Labor Market Impact Assessment (a document Canadian employers must submit before being able to hire some foreign workers that proves the worker will have a neutral or positive impact on the economy). Applicants are eligible based on reciprocal benefits enjoyed by Canadians (such as those under NAFTA) and broader positive cultural and economic impacts on Canada. Adapted from Statistics Canada, open.canada.ca, 2000 to 2023. This does not constitute an endorsement by Statistics Canada of this product.
Citation formats