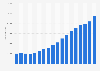
| Characteristic | Number of permit holders |
|---|---|
| 2000 | 22,470 |
| 2001 | 26,130 |
| 2002 | 29,220 |
| 2003 | 33,955 |
| 2004 | 37,150 |
| 2005 | 43,320 |
| 2006 | 53,925 |
| 2007 | 78,225 |
| 2008 | 110,505 |
| 2009 | 112,475 |
| 2010 | 92,070 |
| 2011 | 81,525 |
| 2012 | 86,505 |
| 2013 | 103,910 |
| 2014 | 93,745 |
| 2015 | 60,000 |
| 2016 | 51,070 |
| 2017 | 46,050 |
| 2018 | 56,030 |
| 2019 | 73,355 |
| 2020 | 76,405 |
| 2021 | 81,435 |
| 2022 | 119,235 |
| 2023 | 188,580 |
The chart is not accessible to screen readers. Please switch to the table view to access the data.
Loading statistic...
Download
Source
Source
Release date
December 2023
More information
Region
Canada
Survey time period
2000 to 2023
Supplementary notes
The Temporary Foreign Worker Program allows Canadian employers to recruit foreign workers to fill temporary shortages. The employer must complete a Labour Market Impact Assessment to prove that no Canadian can fill the job and that the foreign worker will have a neutral or positive impact on the economy. Adapted from Statistics Canada, open.canada.ca, 2000 to 2023. This does not constitute an endorsement by Statistics Canada of this product.
Citation formats