
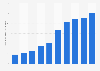


| Characteristic | Percentage change in retail sales |
|---|---|
| - | - |
| - | - |
| - | - |
| - | - |
| - | - |
| - | - |
| - | - |
| - | - |
| - | - |
| - | - |
| - | - |
| - | - |
| - | - |
| - | - |
| - | - |
| - | - |
| - | - |
| - | - |
| - | - |
| - | - |
| - | - |
| - | - |
The chart is not accessible to screen readers. Please switch to the table view to access the data.
Download
Source
Sources
Release date
January 2018
More information
Region
United Kingdom
Survey time period
January 2016 to October 2017
Supplementary notes
* Includes mail order and phone sales.
The source adds the following information: "The BRC KPMG Retail Sales Monitor measures changes in the actual value (including VAT) of retail sales, excluding automotive fuel. The Monitor measures the value of spending and hence does not adjust for price or VAT changes. If prices are rising, sales volumes will increase by less than sales values. In times of price deflation, sales volumes will increase by more than sales values."
Citation formats



