| Characteristic | Net sales in billion U.S. dollars |
|---|---|
| - | - |
| - | - |
| - | - |
| - | - |
| - | - |
| - | - |
| - | - |
| - | - |
| - | - |
| - | - |
| - | - |
| - | - |
| - | - |
| - | - |
| - | - |
| - | - |
| - | - |
| - | - |
| - | - |
| - | - |
| - | - |
| - | - |
| - | - |
| - | - |
The chart is not accessible to screen readers. Please switch to the table view to access the data.
April 2020
Worldwide
Q1 2014 to Q4 2019
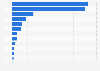
Regulated open-end funds include mutual funds, exchange-traded funds (ETFs), and institutional funds.
Net sales are new sales plus reinvested dividends less redemptions plus net exchanges.
The source adds the following information: "Forty-four jurisdictions reported data from Q1 2015 through Q3 2016; 45 jurisdictions reported data in Q4 2016. Assets of reporting jurisdictions represented 96 percent of assets of all jurisdictions at the end of 2016:Q4. Forty-eight jurisdictions reported data from Q1 2017 through Q3 2017; 47 jurisdictions reported data in Q4 2017 and Q1 2018. Assets of reporting jurisdictions represented 95 percent of assets of all jurisdictions at the end of 2018: Q1".