| Characteristic | in million euros |
|---|---|
| - | - |
| - | - |
| - | - |
| - | - |
| - | - |
| - | - |
| - | - |
| - | - |
| - | - |
| - | - |
| - | - |
| - | - |
| - | - |
| - | - |
| - | - |
| - | - |
| - | - |
| - | - |
| - | - |
| - | - |
| - | - |
| - | - |
| - | - |
| - | - |
| - | - |
| - | - |
| - | - |
| - | - |
| - | - |
| - | - |
| - | - |
| - | - |
| - | - |
The chart is not accessible to screen readers. Please switch to the table view to access the data.
December 2015
Netherlands
2014*
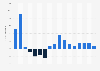
The source defines capital services as: "The productive inputs, per period, that flow to production from a capital asset".
The source specifies: "The most important types of capital are included in the growth accounts. The capital stocks are included, as are the oil and natural gas reserves. In addition inventories, agricultural land and land underlying buildings are included. The value of capital services is equal to the costs of capital services, these costs are known as the user costs of capital."
In regards to the used model, the source adds: "The official SN calculations use an ex ante interest rate based on the internal reference rate of banks and a risk premium for calculating capital services. The model allows for profits to be made as opposed to the neoclassical model."
* The figures for 2014 are provisional.
The market sector is made up of all branches, except for real estate, education, public administration and services and the activities of households as employers and for their own use.