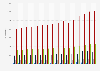
| Characteristic | Average annual growth rate |
|---|---|
| - | - |
| - | - |
| - | - |
| - | - |
| - | - |
| - | - |
| - | - |
| - | - |
| - | - |
| - | - |
| - | - |
| - | - |
| - | - |
| - | - |
| - | - |
| - | - |
| - | - |
| - | - |
| - | - |
| - | - |
The chart is not accessible to screen readers. Please switch to the table view to access the data.
Download
Source
Source
Release date
April 2022
More information
Region
Australia
Survey time period
FY 1990 to FY 2021
Supplementary notes
Note: Gross value added measures the contribution to the economy of each individual producer, industry or sector.
Australia's financial years run from July to June of the following year. For example, FY 2017 starts on July 1, 2016 and ends on June 30, 2017.
Citation formats