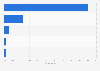
| Characteristic | 15-24 years | 25-49 years | 50-64 years |
|---|---|---|---|
| 2022 | 16.4% | 5.2% | 3.6% |
| 2021 | 18.2% | 5.8% | 4.3% |
| 2020 | 15.3% | 5.2% | 4% |
| 2019 | 14.2% | 5% | 3.8% |
| 2018 | 15.8% | 5.4% | 4.3% |
| 2017 | 19.3% | 6.5% | 5.4% |
| 2016 | 20.1% | 7.5% | 5.5% |
| 2015 | 22.1% | 8% | 5.8% |
| 2014 | 23.2% | 8% | 5.5% |
| 2013 | 23.7% | 7.8% | 5.2% |
| 2012 | 19.8% | 7.2% | 4.6% |
| 2011 | 18.7% | 6.6% | 4.5% |
| 2010 | 22.4% | 7.6% | 5.3% |
| 2009 | 21.9% | 7.1% | 5.1% |
| 2008 | 18% | 6.3% | 4.6% |
The chart is not accessible to screen readers. Please switch to the table view to access the data.
Zoomable Statistic: Select the range in the chart you want to zoom in on.
Loading statistic...
Download
Source
Source
Release date
March 2023
More information
Region
Belgium
Survey time period
2008 to 2022
Supplementary notes
Statistics Belgium defines unemployment rate as the percentage unemployed people within the national labor force (that means employed as well as unemployed people) between the age of 15 and 64.
Citation formats