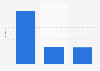
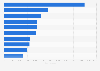
| Characteristic | Percentage change in sales |
|---|---|
| - | - |
| - | - |
| - | - |
| - | - |
| - | - |
The chart is not accessible to screen readers. Please switch to the table view to access the data.
Download
Source
Sources
Release date
September 2015
More information
Region
United Kingdom (Great Britain)
Survey time period
2010 to 2014*
Supplementary notes
Sales data is for all outlets excluding health food stores.
* 52 week periods ending on the last Saturday in December. Change refers to percentage change on the same period a year earlier, except for 2011 which is change compared to the 52 week ending January 1, 2011 (not December 25, 2010).
Data from 2009 to 2013 taken from
Citation formats