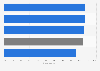
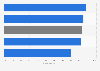
| Frequency of car/van use | User | Non-user |
|---|---|---|
| - | - | - |
| - | - | - |
| - | - | - |
The chart is not accessible to screen readers. Please switch to the table view to access the data.
Download
Source
More information
Region
United Kingdom
Survey time period
February 2015
Number of respondents
1,034*
Method of interview
Omnibus survey
Supplementary notes
* Total 1,034 respondents, base count of frequency of car/van usage:
Never - 61;
Less than once a day - 457;
At least once a day - 485.
This statistic is using original data from the Department for Transport and includes copyright material from 漏 Crown, licensed under the
Citation formats