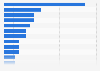
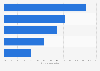
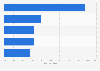
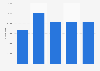
| Characteristic | Share of museums |
|---|---|
| - | - |
| - | - |
| - | - |
The chart is not accessible to screen readers. Please switch to the table view to access the data.
Download
Source
Source
Release date
September 2018
More information
Region
Canada, Mexico, United States
Survey time period
2017
Number of respondents
212 respondents
Special properties
members of the Association of Art Museum Directors
Supplementary notes
The data was collected in 2017 and reflects AAMD members鈥� Fiscal Year 2016 or Fiscal Year 2017 data, depending on their fiscal calendar.
Percentage point less than 100 percent are likely due to rounding.
Citation formats