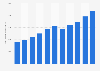
| Characteristic | Income in billion Canadian dollars |
|---|---|
| 2022 | 131.04 |
| 2021 | 122.81 |
| 2020 | 115.81 |
| 2019 | 110.68 |
| 2018 | 106.38 |
| 2017 | 100.38 |
| 2016 | 94.87 |
| 2015 | 92.86 |
| 2014 | 87.85 |
| 2013 | 82.73 |
| 2012 | 78.1 |
| 2011 | 74.38 |
| 2010 | 70.33 |
| 2009 | 66.72 |
| 2008 | 64.93 |
| 2007 | 62.16 |
| 2006 | 58.22 |
| 2005 | 54.53 |
| 2004 | 51.29 |
| 2003 | 47.87 |
| 2002 | 45.48 |
The chart is not accessible to screen readers. Please switch to the table view to access the data.
Loading statistic...
Download
Source
Source
Release date
June 2024
More information
Region
Canada
Survey time period
2002 to 2022
Supplementary notes
1) Taxfilers are people who filed a tax return for the reference year and were alive at the end of the year.
2) Dependent is a member of a family who did not file a personal income tax return for the referenced year.
3) Private pensions include pension benefits other than Old Age Security (OAS), Canada Pension Plan (CPP) and Quebec Pension Plan (QPP). Adapted from Statistics Canada, statcan.gc.ca, 2001 to 2021. This does not constitute an endorsement by Statistics Canada of this product.
Citation formats