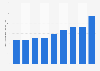


| Characteristic | Percentage of respondents |
|---|---|
| - | - |
| - | - |
| - | - |
| - | - |
| - | - |
| - | - |
The chart is not accessible to screen readers. Please switch to the table view to access the data.
Download
Source
Sources
Release date
May 2015
More information
Region
United States
Survey time period
September 12 to September 22, 2014
Number of respondents
8,470 respondents
Age group
18 to 64 years
Special properties
Smartphone users who used any app in the past 7 days
Method of interview
Online survey
Supplementary notes
Percentages based on Top 2 Box. Question: "Thinking about the [...] apps that you use frequently and those that you do not use very often or at all, to what extent do you agree or disagree that the following attributes are true of [...] apps that you use more frequently?"
Citation formats