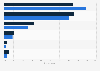
| Characteristic | Pay-to-Play Low End | Pay-to-Play Premium | GaaS Low-End | GaaS Premium |
|---|---|---|---|---|
| 2025* | 297.6 | 182.7 | 1,829.4 | 388.2 |
| 2024* | 292.9 | 179.5 | 1,803.5 | 381.4 |
| 2023* | 288.6 | 176.5 | 1,775.1 | 376.9 |
| 2022* | 283.8 | 174.3 | 1,746.5 | 371.2 |
| 2021* | 279.4 | 172.1 | 1,722.6 | 366.5 |
| 2020 | 275 | 169.8 | 1,695.2 | 359.6 |
| 2019 | 255.9 | 148.9 | 1,480.4 | 336.3 |
| 2018 | 255.8 | 143.9 | 1,434.5 | 326.2 |
| 2017 | 247.5 | 140.1 | 1,379.4 | 317.5 |
| 2016 | 238.6 | 135.7 | 1,339.6 | 306.2 |
| 2015 | 231.7 | 131 | 1,300.8 | 295.9 |
| 2014 | 224.2 | 126 | 1,259.8 | 285 |
| 2013 | 217.4 | 121.9 | 1,217.2 | 277.3 |
| 2012 | 211.3 | 117.1 | 1,180.8 | 267.8 |
| 2011 | 204.6 | 112.4 | 1,138.1 | 260.5 |
| 2010 | 199 | 108.5 | 1,098.9 | 253.1 |
| 2009 | 192.5 | 104.7 | 1,064 | 244.6 |
| 2008 | 186.8 | 101 | 1,026.9 | 233.6 |
The chart is not accessible to screen readers. Please switch to the table view to access the data.
Loading statistic...
Download
Source
Source
Release date
August 2021
More information
Region
Worldwide
Survey time period
2008 to 2020
Special properties
total users is not a sum of categories, users of multiple categories are only counted once
Supplementary notes
*Forecast
PC Pay-to-Play Low End: Games that have an upfront charge of $20 or less
PC Pay-to-Play Premium: Games that have an upfront charge of $20 or more (before sales or discounts)
PC GAAS Low-End: Games as a service (GAAS) that are free to play, have limited monetization and/or low system requirements
PC GAAS Premium: Games as a service (GAAS) that may initially be free but have an aggressive monetization model
Citation formats