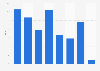
| Characteristic | Children | Working-age adults | Pensioners | Families where someone is disabled* |
|---|---|---|---|---|
| 2023/24 | 3.9 | 6.9 | 1.6 | 5.4 |
| 2022/23 | 3.6 | 6.9 | 1.4 | 5 |
| 2021/22 | 3.3 | 6.6 | 1.4 | 5.2 |
| 2020/21 | 3.3 | 6.6 | 1.2 | - |
| 2019/20 | 3.5 | 6.8 | 1.5 | 4.9 |
| 2018/19 | 3.6 | 7.6 | 1.6 | 5.1 |
| 2017/18 | 3.6 | 7.2 | 1.6 | 5 |
| 2016/17 | 3.5 | 7.4 | 1.5 | 4.9 |
| 2015/16 | 3.6 | 7.5 | 1.6 | 5.1 |
| 2014/15 | 3.7 | 7.6 | 1.5 | 5 |
| 2013/14 | 3.8 | 8 | 1.7 | 5.2 |
| 2012/13 | 3.9 | 8.4 | 1.7 | 5 |
| 2011/12 | 3.8 | 8.1 | 1.7 | 4.7 |
| 2010/11 | 3.6 | 7.8 | 1.6 | 4.4 |
| 2009/10 | 3.7 | 7.7 | 1.7 | 4.3 |
| 2008/09 | 3.9 | 7.7 | 1.7 | 4.3 |
| 2007/08 | 4 | 7.4 | 1.9 | 4.6 |
| 2006/07 | 4 | 7.3 | 2 | 4.5 |
| 2005/06 | 3.9 | 7.3 | 1.9 | 4.6 |
| 2004/05 | 3.8 | 6.8 | 2 | 4.5 |
| 2003/04 | 3.9 | 7.1 | 2.5 | 4.7 |
| 2002/03 | 4.1 | 7.2 | 3 | 5.2 |
| 2001/02 | 4.4 | 7.1 | 3.2 | 5.5 |
| 2000/01 | 4.8 | 8 | 3.5 | 6.3 |
| 1999/00 | 5.3 | 8.6 | 3.9 | 6.6 |
| 1998/99 | 5.7 | 9 | 4.3 | 7.4 |
| 1997/98 | 5.8 | 9.4 | 4.5 | 7.5 |
| 1996/97 | 6.1 | 10.1 | 4.7 | 7.1 |
| 1995/96 | 6.5 | 10.8 | 5.1 | 8 |
| 1994/95 | 6.5 | 10.8 | 5.2 | - |
The chart is not accessible to screen readers. Please switch to the table view to access the data.
March 2025
United Kingdom
April 1, 1994 to March 31, 2024
This statistic using original data from the Department for Work and Pensions and includes copyright material licensed under 漏 Crown, the
Absolute low income is defined as living in households with income below 60% of the median in 2010/11 and adjusted for inflation.
Data prior to 2002/03 is for Great Britain only
*The source adds the following information regarding this type of data: 'Analysis for FYE 2021 is not available. This is a consequence of the decision not to publish additional breakdowns of the headline measures in this statistical release, in response to the coronavirus (COVID-19) pandemic data quality issues.'