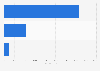
| Characteristic | Percentage of physicians |
|---|---|
| Are employed by hospital or group | 58 |
| Are in private practice | 31 |
| Are in solo practice | 18 |
| In groups of 11 or more | 44 |
| Limit/do not see Medicaid patients | 32 |
| Limit/do not see Medicare patients | 22 |
| Spend between 11 and 15 hours each week on Non-clinical (paperwork) duties | 19 |
| Say morale is very or somewhat negative | 55 |
| Plan to retire in the next three years | 17 |
| Will switch to concierge | 2 |
| Workload at capacity or overextended | 80 |
| Would not recommend medicine as a career | 51 |
| Average hours per week (hours) | 51 |
| Average patients seen per day (number) | 20 |
The chart is not accessible to screen readers. Please switch to the table view to access the data.
Loading statistic...
Download
Source
Sources
Release date
September 2018
More information
Region
United States
Survey time period
April to June 2018
Number of respondents
8,774 physicians
Method of interview
Online survey
Supplementary notes
Figures have been rounded.
Citation formats