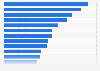
| Brand | 2012 | 2013 |
|---|---|---|
| Sprite | 48% | 41% |
| 7-Up | 25% | 32% |
| Fanta | 26% | 26% |
| Mirinda | 33% | 32% |
| Limca | 21% | 30% |
| Coca-Cola | 28% | 28% |
| Thums up | 42% | 36% |
| Pepsi Cola | 25% | 18% |
| Mountain Dew | 8% | 8% |
| Lilt | 0% | 2% |
| Appletiser | 1% | 1% |
| Dr Pepper | 1% | 1% |
| Lucozade | 1% | 1% |
| Big | 0% | 1% |
The chart is not accessible to screen readers. Please switch to the table view to access the data.
Loading statistic...
Download
Source
Source
Release date
February 2014
More information
Region
India
Survey time period
2012 and 2013
Number of respondents
16,000**
Method of interview
Online survey
Supplementary notes
* Defined as the percentage of respondents who have purchased that brand in the last three to twelve months.
** Approximately 1,500 respondents were surveyed for each region, with the largest two markets (India and China) having a larger sample size of 2,500 each. The male-to-female split between respondents was roughly 50:50 in all cases, with rural-to-urban split varying by country. A total of 16,000 respondents were screened and surveyed.
Citation formats