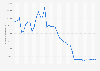
| Characteristic | Number of agents |
|---|---|
| Miami (Coastal Border) | 128 |
| New Orleans (Coastal Border) | 71 |
| Ramey (Coastal Border) | 56 |
| Coastal Border Sectors Total | 255 |
| Blaine (Northern Border) | 274 |
| Buffalo (Northern Border) | 261 |
| Detroit (Northern Border) | 406 |
| Grand Forks (Northern Border) | 171 |
| Havre (Northern Border) | 167 |
| Houlton (Northern Border) | 188 |
| Spokane (Northern Border) | 254 |
| Swanton (Northern Border) | 298 |
| Northern Border Sectors Total | 2,019 |
| Big Bend, formerly Marfa (Southwest Border) | 540 |
| Del Rio (Southwest Border) | 1,504 |
| El Centro (Southwest Border) | 904 |
| El Paso (Southwest Border) | 2,256 |
| Laredo (Southwest Border) | 1,734 |
| Rio Grande Valley, formerly McAllen (Southwest Border) | 3,119 |
| San Diego (Southwest Border) | 2,297 |
| Tucson (Southwest Border) | 3,615 |
| Yuma (Southwest Border) | 784 |
| Southwest Border Sectors Total* | 16,878 |
| Nationwide Total** | 19,740 |
Download
Source
Source
Release date
August 2021
More information
Region
United States
Survey time period
fiscal year 2020
Supplementary notes
Agent staffing statistics depict FY2020 on-board personnel data as of September 30, 2020 and include re-employed annuitants.
*Also include Special Operations Group.
**Include all on-board Border Patrol agents in CBP and re-employed annuitants.
Citation formats