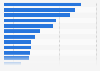
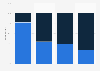
| Characteristic | Number of videos per viewer |
|---|---|
| - | - |
| - | - |
| - | - |
| - | - |
| - | - |
The chart is not accessible to screen readers. Please switch to the table view to access the data.
Download
Source
Sources
Release date
March 2014
More information
Region
United States
Survey time period
Q4 2012 to Q4 2013
Special properties
desktop video viewing only, does not include viewing from other devices such as game consoles, tablets and smartphones
Supplementary notes
Figures represent monthly averages for each quarter.
Figures have been rounded.
Citation formats