| Characteristic | in British pounds |
|---|---|
| - | - |
| - | - |
| - | - |
| - | - |
| - | - |
| - | - |
| - | - |
| - | - |
| - | - |
| - | - |
The chart is not accessible to screen readers. Please switch to the table view to access the data.
Download
Source
Source
Release date
September 2016
More information
Region
United Kingdom
Survey time period
2008 to 2015
Age group
Supplementary notes
* Forecast.
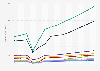
RevPAR=Revenue per Available Room Room revenue. This is divided by rooms available (occupancy times average room rate will closely approximate to RevPAR).
Citation formats