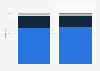
| Characteristic | Value in GBP |
|---|---|
| - | - |
| - | - |
| - | - |
| - | - |
| - | - |
| - | - |
| - | - |
| - | - |
| - | - |
The chart is not accessible to screen readers. Please switch to the table view to access the data.
Download
Source
Source
Release date
July 2017
More information
Region
United Kingdom
Survey time period
2009 to 2017
Special properties
BRC members*
Method of interview
Questionnaire
Supplementary notes
*The source circulated a questionnaire to all its members and responses were received from members who have a total annual sales turnover of circa 拢175 billion, accounting for nearly 50 percent of total UK retail sales (2016: approx. 351 billion). Most of these retails sales arose from around 20,000 shops of all types, in addition to those made via the internet, mobile or mail order channels.
Data for the years 2009 to 2015 has been taken from previous annual payment surveys by the source.
Citation formats