


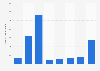

| Characteristic | Percentage of apps |
|---|---|
| - | - |
| - | - |
| - | - |
| - | - |
| - | - |
| - | - |
| - | - |
| - | - |
| - | - |
| - | - |
The chart is not accessible to screen readers. Please switch to the table view to access the data.
Download
Source
Source
Release date
June 2014
More information
Region
Worldwide
Survey time period
March 2014
Special properties
users who first downloaded apps in 3rd quarter 2013
Supplementary notes
The retention metrics for each cohort are based on users who first downloaded an app in Q3 of each year, and then identified how many times those apps were launched on the same devices through March 15th of the following year.
Citation formats





