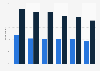
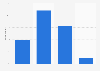
| Characteristic | 2014 | 2015 | 2016 | 2017/18 | 2019 |
|---|---|---|---|---|---|
| The more I read, the better I become | 82% | 80.1% | 82% | - | - |
| If I am a good reader it means that I鈥檒l get a better job when I grow up | 54% | 54.6% | 60.4% | 55.6% | 55.1% |
| I prefer watching TV to reading | 55.2% | 54.3% | - | - | - |
| Reading is cool | 40.2% | 42.4% | 48.4% | 41.1% | 40.7% |
| I cannot find things to read that interest me | 30.3% | 30.8% | 36.7% | 33.7% | 34% |
| I do not read as well as other pupils in my class | 30.1% | 29.3% | 31.8% | - | - |
| I only read when I have to | 27.6% | 27.9% | 34% | 30.6% | 30.8% |
| My parents don鈥檛 care whether I spend any time reading | 24.3% | 25.3% | - | - | - |
| I would be embarrassed if my friends saw me read | 17.2% | 16.5% | - | - | - |
| Reading is more for girls than boys | 11.3% | 10.1% | - | - | - |
The chart is not accessible to screen readers. Please switch to the table view to access the data.
Loading statistic...
Download
Source
Source
Release date
February 2020
More information
Region
United Kingdom
Survey time period
2014 to 2019
Number of respondents
56,906*
Age group
8-18 years
Special properties
school children
Method of interview
Online survey
Supplementary notes
* n (2014) = 32,026; n (2015) = 32,569; n (2016) = 42,406; n (2017/2018) = 49,049; n (2019) = 56,906.
Citation formats