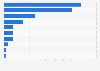
| Characteristic | Share of respondents |
|---|---|
| Culinary cocktails (e.g. savory, fresh ingredients, herb-infused) | 68% |
| Locally produced spirits/wine/beer | 67% |
| Craft/artisan spirits | 66% |
| Onsite barrel-aged drinks | 64% |
| Regional signature cocktails | 59% |
| Food-beer pairings | 58% |
| House-brewed beer | 56% |
| Food-liquor/cocktail pairings | 55% |
| Non-traditional liquors (e.g. soju/sochu, cachaca, pisco) | 54% |
| Organic beer/wine/spirits | 50% |
| Wine on tap/draft wine | 49% |
| Spicy cocktails | 43% |
| Growlers/crowlers | 38% |
| Anise-flavored cocktails | 26% |
| Egg-whites in cocktails | 22% |
The chart is not accessible to screen readers. Please switch to the table view to access the data.
Loading statistic...
Download
Source
Source
Release date
January 2018
More information
Region
United States
Survey time period
October to November 2017
Number of respondents
700 respondents
Age group
18 years and older
Special properties
chef members of the American Culinary Federation
Method of interview
Online survey
Supplementary notes
* Forecast.
The survey was conducted among professional chef members of the American Culinary Federation. The chefs were given a list of 161 items and were asked to rate each item as a "hot trend," "yesterday's news" or "perennial favorite" for restaurant menus in 2018.
Citation formats