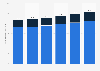
| Characteristic | AB | C1 | C2 | DE |
|---|---|---|---|---|
| - | - | - | - | - |
| - | - | - | - | - |
| - | - | - | - | - |
| - | - | - | - | - |
| - | - | - | - | - |
| - | - | - | - | - |
| - | - | - | - | - |
The chart is not accessible to screen readers. Please switch to the table view to access the data.
Download
Source
Source
Release date
January 2013
More information
Region
United Kingdom
Survey time period
2006 to 2012
Number of respondents
100,000*
Age group
16 years and older
Method of interview
Computer-assisted personal interviews (CAPI)
Supplementary notes
* Approximately
The source used data from its own survey 'Great Britain Tourism Survey (GBTS) 2012',
A - upper middle class
B - middle class
C1 - lower middle class
C2 - skilled working class
D - working class
E - those at lowest level of subsistence
Citation formats