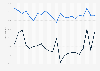
| Characteristic | Share of respondents |
|---|---|
| - | - |
| - | - |
| - | - |
| - | - |
| - | - |
| - | - |
| - | - |
The chart is not accessible to screen readers. Please switch to the table view to access the data.
July 2017
United Kingdom (England)
April 1, 2008 to April 30, 2016
3,014 (latest)**
16 years and older
Face-to-face interview
* All respondents who answered 'fairly strongly' or 'very strongly'. No data available for 2011/2012. Interviews for the latest period were conducted from July 2014 to April 2015.
Methodology information:
A random probability survey that uses the postal address file held by the Post Office as its source to draw a random sample from. Selected addresses were sent a letter, letting them know about the Community Life Survey, after which an interviewer visited the address to attempt to complete the survey. One adult over the age of 16 was randomly selected to take part in the survey in each selected household.
** Number of respondents in 2008-09 = 8,723
Number of respondents in 2009-10 = 8,653
Number of respondents in 2010-11 = 9,620
Number of respondents in 2012-13 = 6,883
Number of respondents in 2013-14 = 5,078
Number of respondents 2014-15 = 2,017
Number of respondents 2015-16 = 3,012
This statistic is using original data from the Government Digital Service and includes copyright material from 漏 Crown, licensed under the