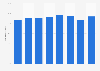
| Characteristic | Percentage of respondents |
|---|---|
| - | - |
| - | - |
| - | - |
| - | - |
| - | - |
| - | - |
| - | - |
| - | - |
| - | - |
| - | - |
| - | - |
| - | - |
| - | - |
The chart is not accessible to screen readers. Please switch to the table view to access the data.
Download
Source
Source
Release date
December 2014
More information
Region
United Kingdom (Great Britain)
Survey time period
3rd quarter 2010 to 4th quarter 2014
Number of respondents
1,000**
Age group
15 years and older
Method of interview
Face-to-face interview
Supplementary notes
* Not digital
**Number of respondents:
Q3 2010 n= 1,056
Q4 2010 n = 1,005
Q1 2011 n = 1,017
Q2 2011 n = 991
Q3 2011 n = 1,022
Q4 2011 n = 973
Q1 2012 n = 984
Q4 2013 n = 1,000
Q2 2014 n = 1,000; Q3 2014 n = 988; Q4 2014 n = 987.
During the survey, this question was posed as follows: "Which of the following do you own/have in your household?"
Citation formats