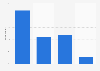
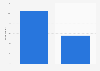
| Characteristic | Yes, legal | No, illegal | No opinion |
|---|---|---|---|
| October 1-19, 2021 | 68% | 32% | 0% |
| September 30-October 13, 2020 | 68% | 32% | 0% |
| October 1-13, 2019 | 66% | 33% | 1% |
| May 15-30, 2019 | 66% | 32% | 2% |
| October 1-10, 2018 | 66% | 32% | 2% |
| October 5-11, 2017 | 64% | 34% | 2% |
| October 5-9, 2016 | 60% | 39% | 1% |
| October 7-11, 2015 | 58% | 40% | 2% |
| October 12-15, 2014 | 51% | 47% | 2% |
| October 3-6, 2013 | 58% | 39% | 3% |
| November 26-29, 2012 | 48% | 50% | 1% |
| October 6-9, 2011 | 50% | 46% | 3% |
| October 7-10, 2010 | 46% | 50% | 4% |
| October 1-4, 2009 | 44% | 54% | 2% |
| October 13-15, 2005 | 36% | 60% | 4% |
| November 10-12, 2003 | 34% | 64% | 2% |
The chart is not accessible to screen readers. Please switch to the table view to access the data.
Loading statistic...
Download
Source
Source
Release date
November 2022
More information
Region
United States
Survey time period
2003 to 2021
Number of respondents
823*
Age group
18 and older
Method of interview
Telephone interview
Supplementary notes
According to the source, the question was asked of half a sample in 2003, 2005, 2009, and 2010.
* Number of respondents in 2021
Citation formats