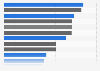
| Characteristic | Wage level in index points (Zurich = 100 points) |
|---|---|
| Zurich | 100 |
| Geneva | 96.3 |
| Copenhagen | 93.5 |
| Oslo | 81.1 |
| Sydney | 77.2 |
| Stockholm | 70.7 |
| New York | 69.4 |
| Luxembourg | 66.2 |
| Munich | 65.5 |
| Los Angeles | 63.4 |
| Frankfurt | 62.9 |
| Brussels | 62.6 |
| Helsinki | 60.7 |
| Toronto | 59.3 |
| Montreal | 58.4 |
| Dublin | 57.6 |
| Amsterdam | 57.3 |
| Berlin | 56.4 |
| Tokyo | 56.1 |
| Chicago | 55.9 |
| Miami | 55.5 |
| London | 55.3 |
| Vienna | 54.1 |
| Paris | 51.1 |
| Lyon | 50.4 |
| Milan | 46.3 |
| Nikosia | 42.1 |
| Auckland | 40.8 |
| Madrid | 40.5 |
| Barcelona | 40.3 |
| Rome | 36.6 |
| Lisbon | 33.1 |
| Athen | 32.5 |
| Tel Aviv | 32.5 |
| Ljubljana | 31.5 |
| Seoul | 29.5 |
| Dubai | 28.8 |
| Sao Paulo | 27.1 |
| Johannesburg | 27.1 |
| Taipeh | 26 |
The chart is not accessible to screen readers. Please switch to the table view to access the data.
Loading statistic...
Download
Source
Source
Release date
August 2011
More information
Region
Worldwide
Survey time period
2011
Supplementary notes
*The wage level is calculated using the gross income, based on statements about wages, social charges and working hours for the 14 most popular professions.
The statistic is based on an index measured on te city of Zurich (Zurich = 100).
Citation formats