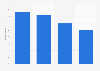
| Characteristic | 2011 | 2012 |
|---|---|---|
| - | - | - |
| - | - | - |
| - | - | - |
| - | - | - |
| - | - | - |
| - | - | - |
| - | - | - |
| - | - | - |
| - | - | - |
The chart is not accessible to screen readers. Please switch to the table view to access the data.
Download
Source
Sources
Release date
June 2012
More information
Region
United States
Survey time period
2011: April 15 to April 20, 2011 / 2012: March 19 to March 26, 2012
Number of respondents
2011: n = 291 / 2012: n = 710
Age group
8-64 years
Special properties
wireless tablet owners/users
Supplementary notes
* regularly = at least once per week
Figures for 2011 come partly from the "A Portrait of Today鈥檚 Tablet User 2011" study.
Citation formats