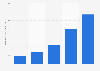
| Characteristic | Operating income in million U.S. dollars |
|---|---|
| 2026 | 577 |
| 2025 | 303.77 |
| 2024 | -143.93 |
| 2023 | 998.74 |
| 2022 | 1,632.2 |
| 2021 | 607.63 |
| 2020 | 927.81 |
| 2019 | 1,190.18 |
| 2018** | 147.55 |
| 2017 | 883.37 |
| 2016 | 1,455.46 |
| 2015 | 1,680.42 |
| 2014 | 1,697.17 |
| 2013 | 1,460.17 |
| 2012 | 1,405.58 |
| 2011 | 1,244.79 |
| 2010 | 820.86 |
| 2009 | 736.82 |
| 2008 | 939 |
| 2007 | 965.44 |
| 2006 | 826.14 |
| 2005 | 767.95 |
The chart is not accessible to screen readers. Please switch to the table view to access the data.
Loading statistic...
Download
Source
Sources
Release date
May 2026
More information
Region
Worldwide
Survey time period
2005 to 2026
Supplementary notes
** Transition period three months ended March 2018 (unaudited).
Operating income figures Reflects adoption of accounting standards update 2017-07, "Compensation - Retirement Benefits (Topic 715): Improving the Presentation of Net Periodic Pension Cost and Net Periodic Postretirement Benefit Cost" and the restatement of prior periods to conform to current year presentation. For the years ended December 2017, 2016, and 2015, operating income increased and other income (expense), net decreased by $9.9 million, $87.2 million and $35.6 million, respectively. In the three months ended March 2018, operating income decreased and other income (expense), net increased by $1.3 million.
听
Figures are taken from yearly听 editions of VF Corporation's Annual Report.
Citation formats