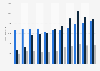
| Characteristic | Pharmaceuticals and Vaccines | Consumer Healthcare | Specialty Medicines** | General Medicines** | Vaccines** |
|---|---|---|---|---|---|
| 2024 | - | - | 11,810 | 10,428 | 9,138 |
| 2023 | - | - | 10,244 | 10,220 | 9,864 |
| 2022** | - | - | 11,269 | 10,118 | 7,937 |
| 2021 | 24,507 | 9,607 | - | - | - |
| 2020 | 24,038 | 10,033 | - | - | - |
| 2019 | 24,711 | 8,995 | - | - | - |
| 2018 | 23,163 | 7,658 | - | - | - |
| 2017 | 22,436 | 7,750 | - | - | - |
| 2016* | 20,696 | 7,193 | - | - | - |
| 2015* | 17,813 | 6,038 | - | - | - |
| 2014* | 18,597 | 4,322 | - | - | - |
| 2013* | 20,743 | 4,713 | - | - | - |
| 2012* | 20,645 | 4,731 | - | - | - |
| 2011 | 21,894 | 5,403 | - | - | - |
| 2010 | 23,284 | 5,108 | - | - | - |
| 2009 | 23,653 | 4,715 | - | - | - |
| 2008 | 20,381 | 3,971 | - | - | - |
| 2007 | 19,163 | 3,553 | - | - | - |
| 2006 | 20,013 | 3,212 | - | - | - |
The chart is not accessible to screen readers. Please switch to the table view to access the data.
Loading statistic...
Download
Source
Source
Release date
February 2025
More information
Region
Worldwide, United Kingdom
Survey time period
2006 to 2024
Supplementary notes
This statistic was assembled from several editions of the GSK Annual Report.
* Values for these years are restated.
** Reflects the spin-off of the Consumer Healthcare business. In the same year, GSK restructured and renamed its divisions (product groups).
Citation formats