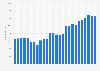
| Characteristic | Dividend per share in euros |
|---|---|
| 2024 | 2.2 |
| 2023 | 2.2 |
| 2022 | 2.2 |
| 2021 | 1.85 |
| 2020 | 1.4 |
| 2019 | 1.3 |
| 2018 | 1.25 |
| 2017 | 1.25 |
| 2016*** | 1.2 |
| 2015*** | 1.05 |
| 2014*** | 1 |
| 2013 | 1.9 |
| 2012 | 1.7 |
| 2011 | 1.5 |
| 2010 | 1.25 |
| 2009 | 1 |
| 2008 | 1.5 |
| 2007** | 1.2 |
| 2006* | 0.9 |
| 2005 | 0.85 |
| 2004 | 0.8 |
| 2003 | 0.8 |
| 2002 | 1 |
| 2001 | 0.95 |
| 2000 | 0.9 |
| 1999 | 0.85 |
The chart is not accessible to screen readers. Please switch to the table view to access the data.
Loading statistic...
Download
Source
Sources
Release date
March 2025
More information
Region
Worldwide, Germany
Survey time period
1999 to 2024
Supplementary notes
This statistic was assembled from several editions of the Merck KGaA Annual Report. The company Merck KGaA operates under the umbrella brand EMD (Millipore) in North America.
* In order to harmonize accounting practices, certain customer rebates in the Pharmaceuticals sector were listed seperately, starting in 2006.
** Following the acquisition of the Swiss biopharmaceutical company Serono, the company was added to Merck under the Ethicals division in 2007.
*** Taking into account the share split; previous year鈥檚 figures have been adjusted accordingly.
Citation formats