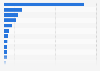
| Characteristic | Mobile | Desktop |
|---|---|---|
| - | - | - |
| - | - | - |
| - | - | - |
| - | - | - |
| - | - | - |
| - | - | - |
| - | - | - |
| - | - | - |
| - | - | - |
| - | - | - |
| - | - | - |
| - | - | - |
| - | - | - |
| - | - | - |
| - | - | - |
| - | - | - |
| - | - | - |
| - | - | - |
| - | - | - |
| - | - | - |
The chart is not accessible to screen readers. Please switch to the table view to access the data.
Download
Source
Source
Release date
November 2016
More information
Region
United States
Survey time period
January 2015 to September 2016
Special properties
average active sessions; from 6:00 am to 8:00 pm, Monday through Friday
Supplementary notes
The source defines an average active session as total listening hours divided by hours in the reported time period. Total listening hours are defines as the total number of hours that the station/publisher has streamed during sessions with a duration of at least one minute in total within the reported time period
Figures before January 2016 taken from previous reports
Figure for December 2015 not available.
Citation formats